COMMODITY MAPPING TOOL AND PROGRAM

 “TSC’s THESIS data show that companies struggle to document and map their supply chain origins. Only 8% of nearly 800 suppliers have transparency to the farm. The majority of food and beverage companies using THESIS do not even know the country of origin for their product supply chains. Ending deforestation, slave labor, and decarbonizing agriculture and forest supply chains hinges on companies knowing where their supply chains originate.” – Christy Slay

About
The Commodity Mapping tool provides transparency and insight into your agriculture product supply chain leading to consumer trust while also allowing you to prioritize, manage risks, and take demonstratable action on sustainability issues. TSC’s Commodity Mapping tool is designed to help members visualize and communicate their most likely risks in their product supply chains.
IMPACT
Understand where your most likely commodity source regions are located today and the risks they pose–without having to wait to do time intensive and expensive supply chain analysis
Increases transparency
and understanding of global supply chain source locations and impacts.
Improves the ability to track
and report supply chain metrics in THESIS.
Bridges the data gap for companies
who may know little about their supply chain origins to step them towards knowledge, data-rich tools for better decision making and solutions for taking action.
Accelerates supply chain mapping
to achieve the ultimate goal of ending deforestation and addressing other key sustainability issues.
Engage internal stakeholder
for strategy creation to address priorities.
CUSTOM RISK ANALYSIS
THESIS resources for consumer goods and food suppliers
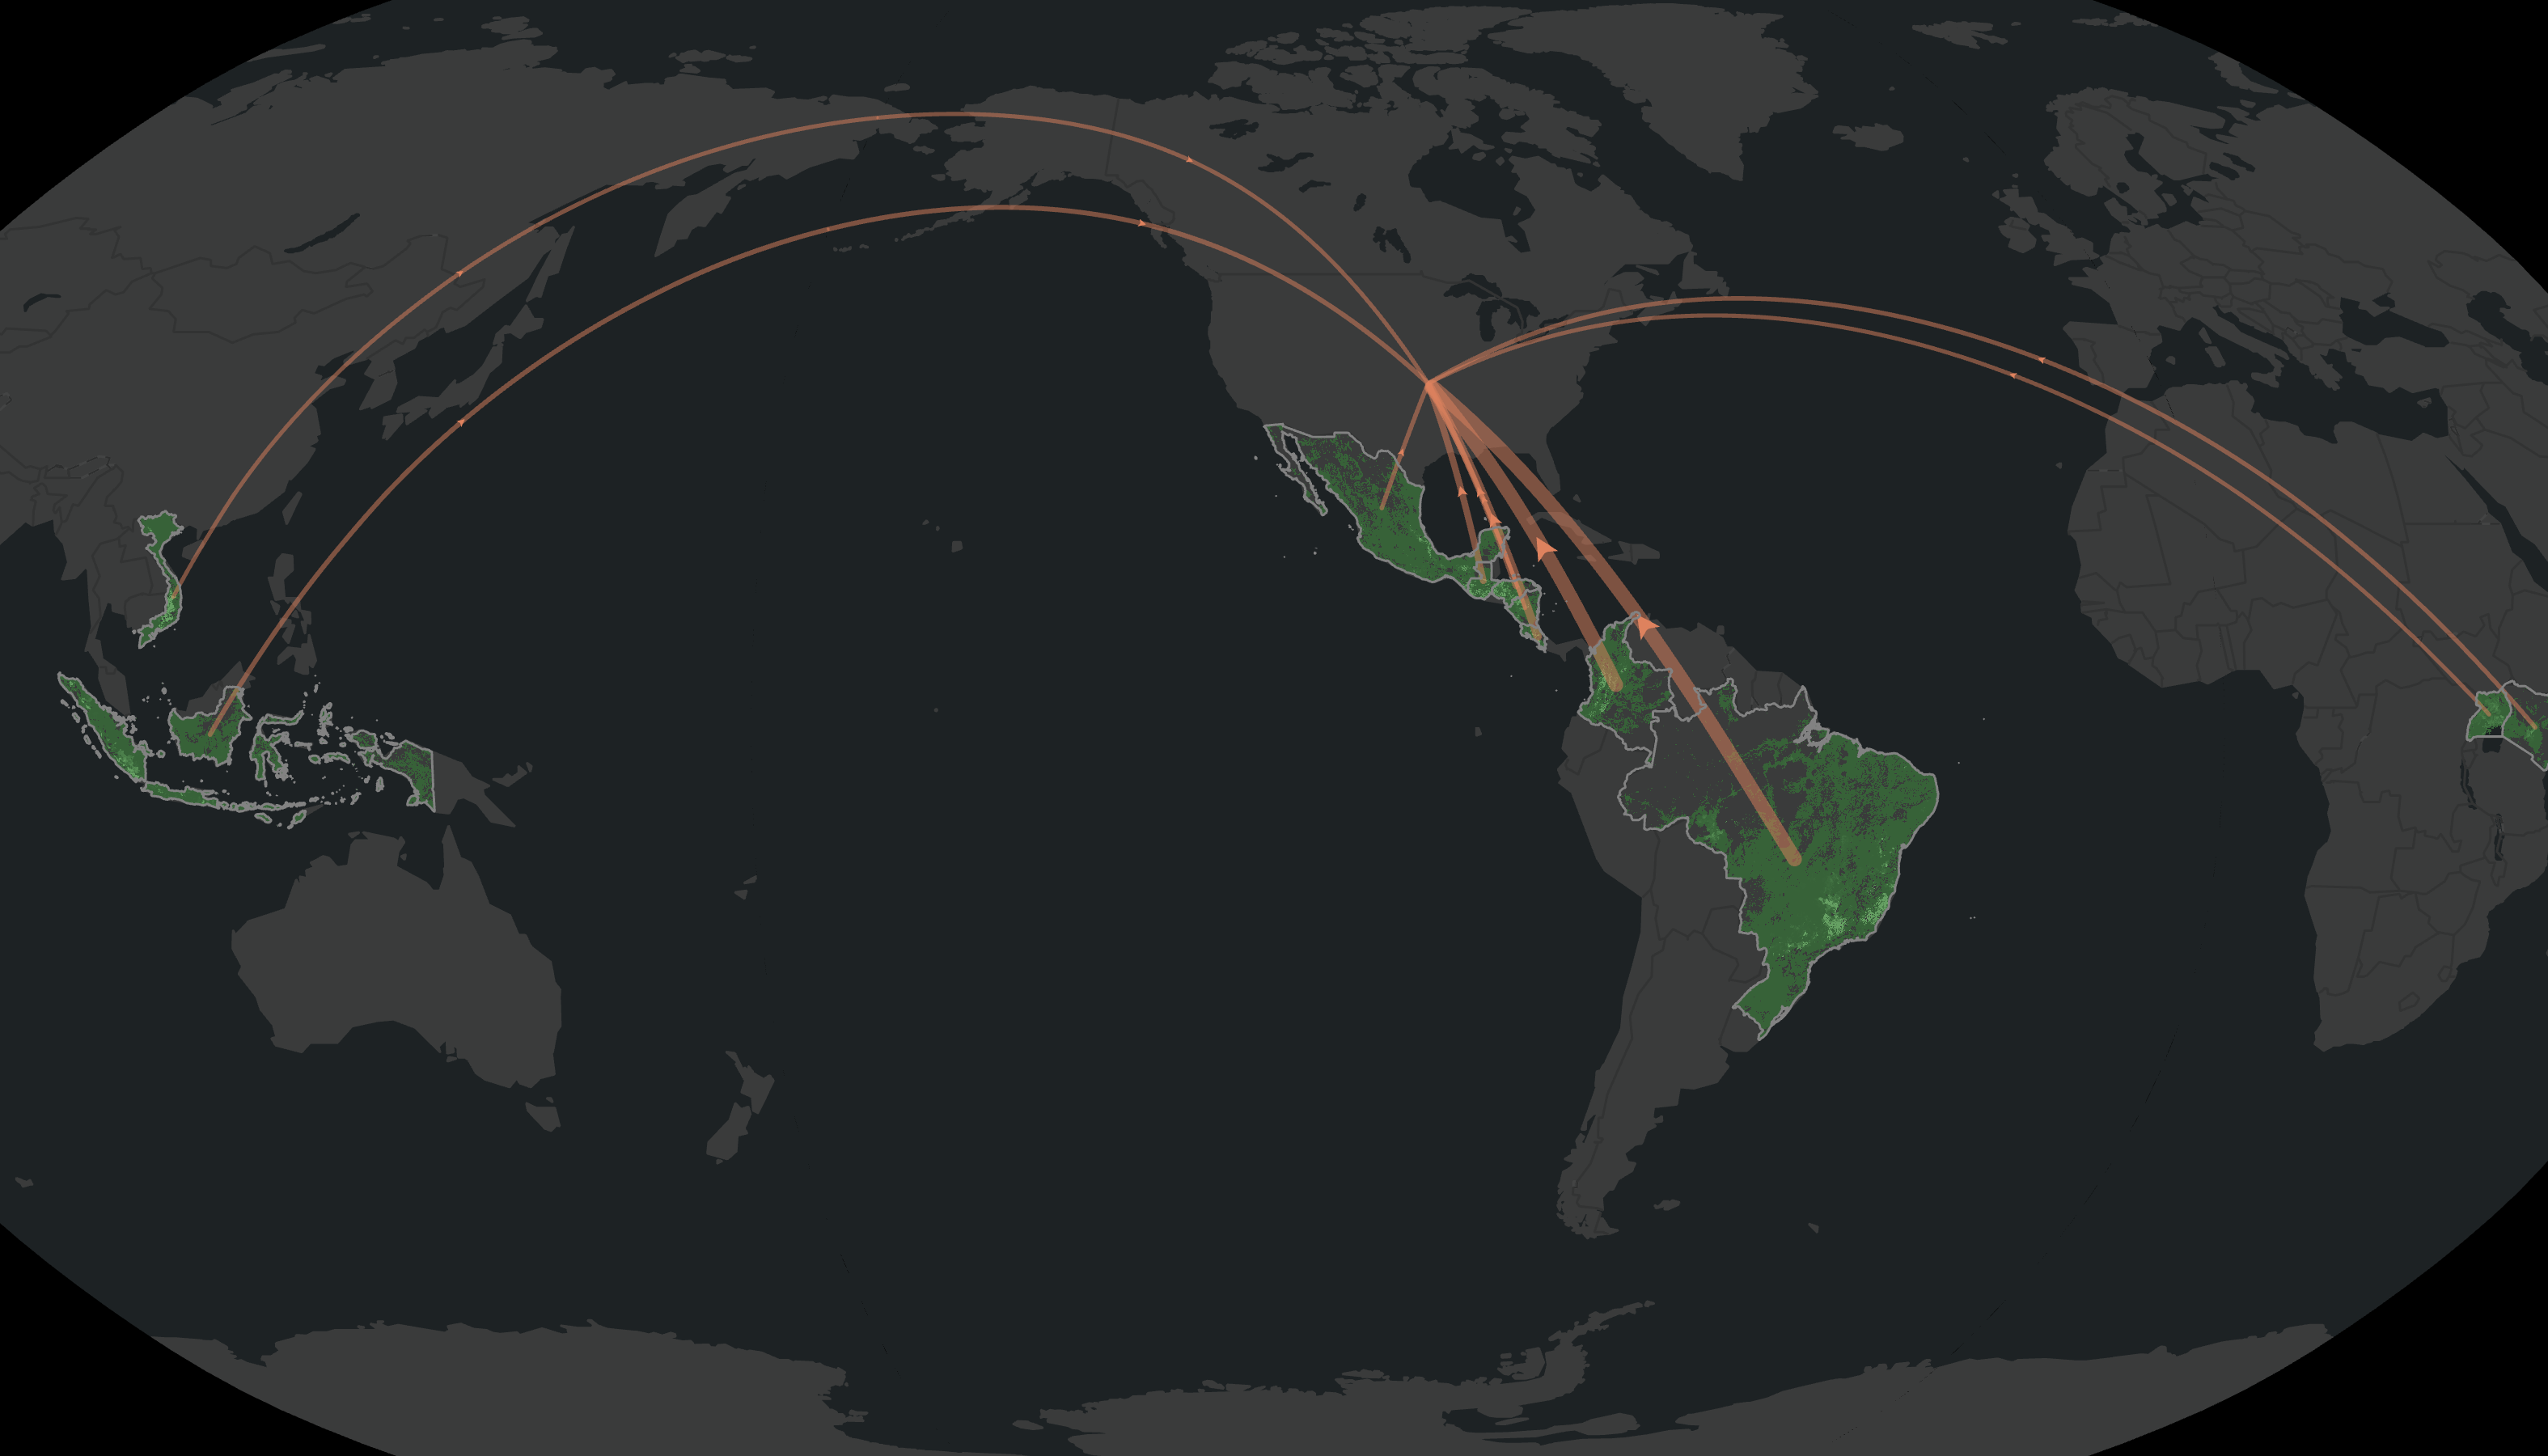
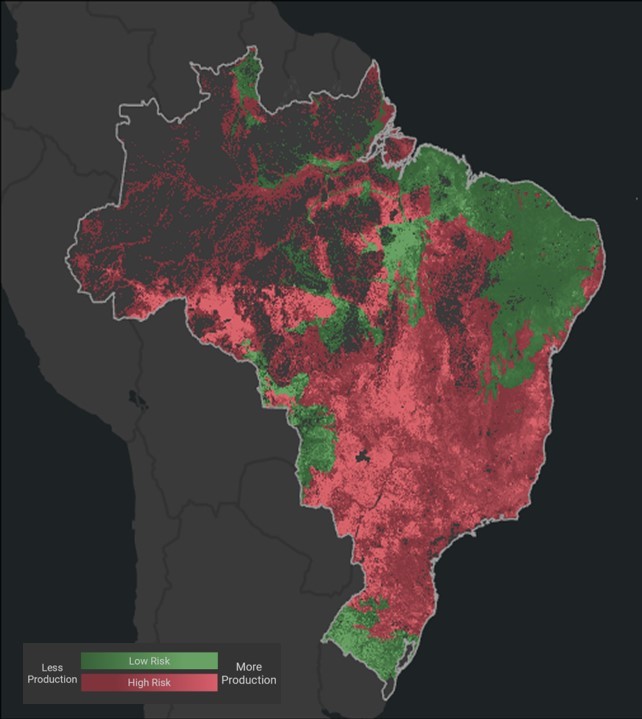
The power of Commodity Mapping versus a typical risk assessment is that Commodity Mapping uses a proprietary model linking trade statistics to production regions to identify source regions and trade routes. The Commodity Mapping Tool is built using powerful statistical software that enables a user to incorporate their own procurement data to analyze supply chain risk in a variety of ways across their business. By focusing, comparing, and weighting supply chain risk by relevant variables, a user can create custom risk analyses. In addition to providing customizable risk reports, the Commodity Mapping Tool generates maps, dashboards, and other visual outputs that can be used to educate and engage leadership, buyers, and others within a business whose participation can help drive sustainability initiatives forward.
Analysis options include:

Commodity Mapping Dashboard Examples
Source: Athenagro, Abiec, Secex, IBGE, Cepea, BNDES

CONNECTING TO TSC’S THESIS ASSESSMENTS
Ending deforestation, decarbonizing agriculture and forest supply chains, and addressing hidden risks of related to water scarcityuse, child and forced labor rights hinges on companies knowing where their supply chains originate. The majority of companies reporting to CDP (70%) do not know where their supply chains are located. Additionally, connecting region-specific commodity mapping data to our THESIS assessments will create easy upload of procurement data and easy transition from relevant KPIs to the tool for maps and dashboards.

Use Cases
TSC’s network of leading companies have utilized our mapping platform to gain support of leadership to expand sustainability teams, act on an issue with an NGO expert partner, create or improve supplier codes of conduct, and set goals for sustainable procurement. TSC has also collaborated with some of the world’s leading experts to create new science and datasets that are used in Commodity Mapping.

Source: Athenagro, Abiec, Secex, IBGE, Cepea, BNDES
- Campbell’s Soup Company: In 2017, Campbell’s used Commodity Mapping to analyze 14 priority ingredients across 5 countries to identify material hotspots in supply chains to communicate with internal and external stakeholders. In 2019, Campbell’s used Commodity Mapping to analyze 30 commodities across more sourcing regions adding human rights, governance, and water metrics to identify new risks and incorporate certifications.
- Science (publication): 2018 TSC, WRI, and Univ. of Maryland published the global drivers of forest loss dataset in the journal Science. It is now the de facto map used to categorize annual forest loss globally. TSC uses this dataset to evaluate the impacts of commodity driven deforestation and smallholder deforestation in supply chains.
- Nature Climate Change (publication): 2021 TSC, WRI, NASA, Wageningen University, Woodwell Climate Research Center, and others collaborated to create a new global forest carbon emissions map in unprecedented detail. Commodity Mapping will use this model to incorporate climate impacts of commodity production from forest loss.
- Walmart’s Forest Conservation Supplier Guide: TSC led the methodology and map creation to rank jurisdictions by the potential ecological impact. The resource identifies priorities for jurisdictional interventions in deforestation-risk commodity production.
- Partners: WWF, Conservation International, EDF, TNC
CASE STUDy
Interested in our Commodity Mapping program?
Commodity Mapping Analysis is performed only on your agricultural source regions

